Note
Click here to download the full example code
Tractography Clustering - Available Metrics
This page lists available metrics that can be used by the tractography clustering framework. For every metric a brief description is provided explaining: what it does, when it’s useful and how to use it. If you are not familiar with the tractography clustering framework, check this tutorial Clustering framework.
Note: All examples assume a function get_streamlines exists. We defined here a simple function to do so. It imports the necessary modules and loads a small streamline bundle.
def get_streamlines():
    from dipy.data import get_fnames
    from dipy.io.streamline import load_tractogram

    fname = get_fnames('fornix')
    fornix = load_tractogram(fname, 'same', bbox_valid_check=False)

    return fornix.streamlines
Average of Pointwise Euclidean Metric
What: Instances of AveragePointwiseEuclideanMetric first compute the pointwise Euclidean distance between two sequences of same length then return the average of those distances. This metric takes as inputs two features that are sequences containing the same number of elements.
When: By default the QuickBundles clustering will resample your streamlines on-the-fly so they have 12 points. If for some reason you want to avoid this and you made sure all your streamlines already have the same number of points, you can manually provide an instance of AveragePointwiseEuclideanMetric to QuickBundles. Since the default Feature is the IdentityFeature the streamlines won’t be resampled thus saving some computational time.
Note: Inputs must be sequences of the same length.
from dipy.segment.clustering import QuickBundles
from dipy.segment.metric import AveragePointwiseEuclideanMetric

# Get some streamlines.
streamlines = get_streamlines()  # Previously defined.

# Make sure our streamlines have the same number of points.
from dipy.tracking.streamline import set_number_of_points
streamlines = set_number_of_points(streamlines, nb_points=12)

# Create the instance of `AveragePointwiseEuclideanMetric` to use.
metric = AveragePointwiseEuclideanMetric()
qb = QuickBundles(threshold=10., metric=metric)
clusters = qb.cluster(streamlines)

print("Nb. clusters:", len(clusters))
print("Cluster sizes:", map(len, clusters))
Nb. clusters: 4
Cluster sizes: <map object at 0x2be7d9fa0>
Nb. clusters: 4

Cluster sizes: [64, 191, 44, 1]
Sum of Pointwise Euclidean Metric
What: Instances of SumPointwiseEuclideanMetric first compute the pointwise Euclidean distance between two sequences of same length then return the sum of those distances.
When: This metric mainly exists because it is used internally by AveragePointwiseEuclideanMetric.
Note: Inputs must be sequences of the same length.
from dipy.segment.clustering import QuickBundles
from dipy.segment.metric import SumPointwiseEuclideanMetric

# Get some streamlines.
streamlines = get_streamlines()  # Previously defined.

# Make sure our streamlines have the same number of points.
from dipy.tracking.streamline import set_number_of_points
nb_points = 12
streamlines = set_number_of_points(streamlines, nb_points=nb_points)

# Create the instance of `SumPointwiseEuclideanMetric` to use.
metric = SumPointwiseEuclideanMetric()
qb = QuickBundles(threshold=10.*nb_points, metric=metric)
clusters = qb.cluster(streamlines)

print("Nb. clusters:", len(clusters))
print("Cluster sizes:", map(len, clusters))
Nb. clusters: 4
Cluster sizes: <map object at 0x2bdd51f40>
Nb. clusters: 4

Cluster sizes: [64, 191, 44, 1]
Cosine Metric
What: Instances of CosineMetric compute the cosine distance between two vectors (for more information see the wiki page).
When: This metric can be useful when you only need information about the orientation of a streamline.
Note: Inputs must be vectors (i.e. 1D array).
import numpy as np
from dipy.viz import window, actor, colormap
from dipy.segment.clustering import QuickBundles
from dipy.segment.featurespeed import VectorOfEndpointsFeature
from dipy.segment.metric import CosineMetric

# Enables/disables interactive visualization
interactive = False

# Get some streamlines.
streamlines = get_streamlines()  # Previously defined.

feature = VectorOfEndpointsFeature()
metric = CosineMetric(feature)
qb = QuickBundles(threshold=0.1, metric=metric)
clusters = qb.cluster(streamlines)

# Color each streamline according to the cluster they belong to.
colormap = colormap.create_colormap(np.arange(len(clusters)))
colormap_full = np.ones((len(streamlines), 3))
for cluster, color in zip(clusters, colormap):
    colormap_full[cluster.indices] = color

# Visualization
scene = window.Scene()
scene.clear()
scene.SetBackground(0, 0, 0)
scene.add(actor.streamtube(streamlines, colormap_full))
window.record(scene, out_path='cosine_metric.png', size=(600, 600))
if interactive:
    window.show(scene)
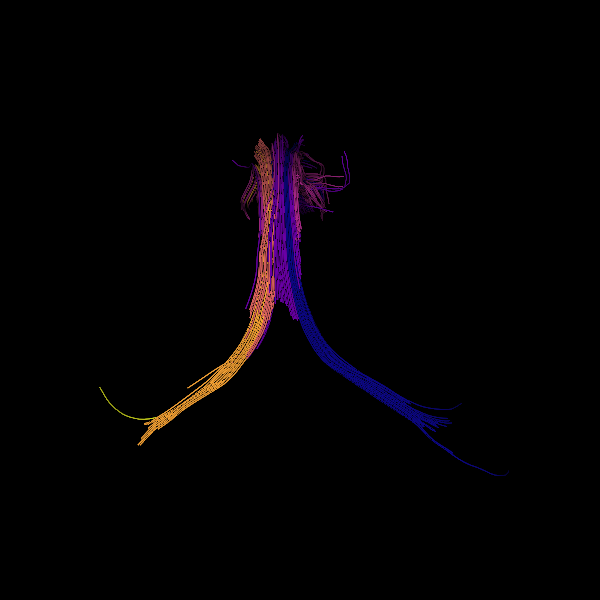

Showing the streamlines colored according to their orientation.
References
Garyfallidis E. et al., QuickBundles a method for tractography simplification, Frontiers in Neuroscience, vol 6, no 175, 2012.
Total running time of the script: ( 0 minutes 0.119 seconds)